The Carbon Ledger: China Pollutes Less per Person Than America or Britain
by Jaffa Levy
·
Published
· Updated
The numbers tell a moral story. An average American still consumes nearly three times more energy than a Chinese citizen, and a Briton far more than an Indian. Yet much of the Western media frames China as the greatest polluter. The record shows that the United States and Europe burned through the shared carbon budget to industrialise and to sustain their living standards. China is late to the party and is developing at a lower level of emissions per person.
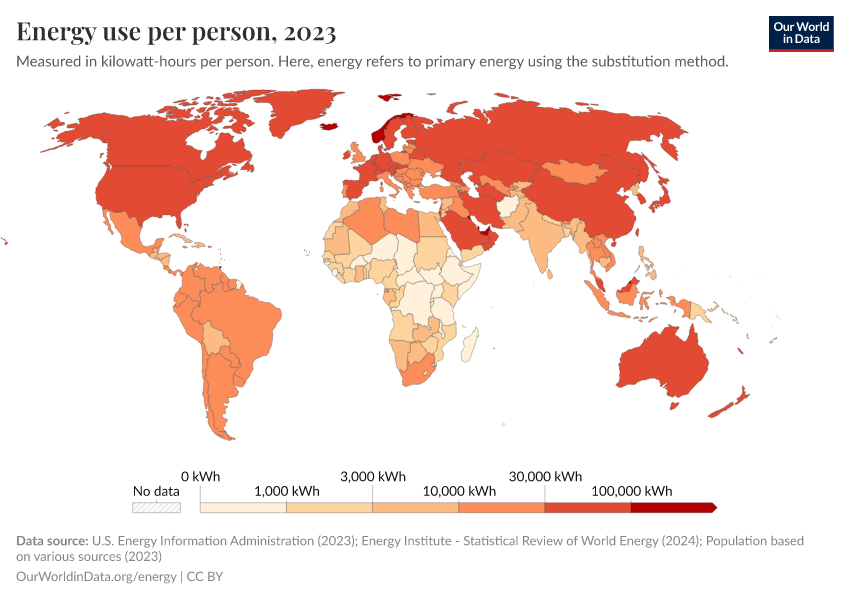
Begin with the arithmetic. The average American uses around seventy five thousand kilowatt hours of primary energy each year. The average Briton uses about twenty eight to thirty thousand. The average Chinese citizen uses roughly thirty three thousand. The average Indian uses seven to eight thousand. These figures describe total energy use, not only household electricity, and they capture the energy embedded in goods, transport and industry. On a per person basis the West still consumes far more than the developing world.
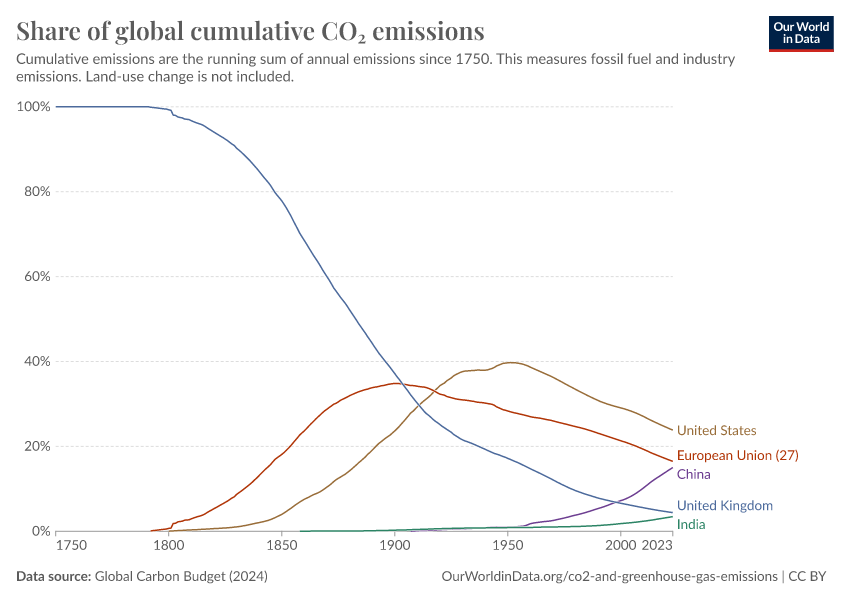
The same pattern holds for the historical carbon ledger. The United States is responsible for about a quarter of all fossil fuel and industry carbon dioxide released since the mid nineteenth century. Europe adds about seventeen percent. China stands at about fifteen percent and India at about three percent. The United Kingdom contributes roughly three percent on a territorial basis. That rises toward five percent if colonial and trade related emissions are attributed back under an adjusted method. These numbers define responsibility across time.
Carbon ledger at a glance
Country or bloc
Share of cumulative fossil and industry CO₂ since 1850
United States
about twenty four percent
European Union
about seventeen percent
China
about fifteen percent
United Kingdom
about three to five percent
India
about three percent
Note. Land use change is not consistently included. Shares refer to fossil fuel combustion and industrial process emissions on a territorial basis unless stated.
Industrialisation and responsibility
Every major economy that industrialised did so by burning coal oil and gas at scale. Modern living standards were built with carbon. No country reached prosperity without first emitting. Industrialisation is both economic and environmental. A fair climate policy must weigh the stock of past emissions and the present flow of energy use per person, not only current national totals.
Per person energy use today
The present flow comparison reinforces the point. Even after the rise of Chinese manufacturing, an average American still consumes more than twice the energy of an average Chinese citizen. A Briton remains above the global median. An Indian uses about one tenth of the American figure. These differences reflect industrial structure, climate, urban form, efficiency and the energy embodied in trade.
Energy use per person
Country
Primary energy use per person per year
United States
about seventy five to eighty megawatt hours
United Kingdom
about twenty eight to thirty megawatt hours
China
about thirty three to thirty five megawatt hours
India
about seven to eight megawatt hours
Values rounded. Primary energy includes conversion losses and covers industrial commercial and residential use.
Source: Our World in Data. Licensed under CC BY 4.0.
The heavy industry bottleneck
The Western media often highlights China’s emissions while omitting context. China has expanded electric vehicles batteries solar and wind at extraordinary speed. The harder task now is to decarbonise heavy industry such as steel cement aluminium and chemicals. These sectors depend on high temperature heat and very large continuous power. They also anchor employment and regional tax bases.
China’s industrial structure means roughly two thirds of its national emissions arise from industry and power generation. The challenge is to move factories to clean electricity hydrogen and carbon capture while maintaining reliability and jobs. Electrification options include electric arc furnaces synthetic graphite electric boilers and industrial heat pumps. If the marginal generator in a region remains fossil fuelled overall emissions fall more slowly.
Source: Our World in Data. Licensed under CC BY 4.0.
The ledger and the flow together
Combine the stock and the flow and the pattern is clear. The United States and Europe accumulated very large shares of the global carbon budget early and still operate at high per person energy use. China is the largest annual emitter by tonnes but holds a far lower cumulative burden per person and sits at a mid range level of current energy use per person. India remains low on both measures.
Per person cumulative carbon burden
Country
Estimated cumulative CO₂ per person since eighteen fifty
United States
about one thousand two hundred fifty to one thousand three hundred tonnes
United Kingdom
about one thousand one hundred tonnes territorial basis
China
about two hundred fifty to three hundred tonnes
India
under one hundred tonnes
Estimates derived from Global Carbon Budget series combined with historical population. Ranges reflect method and start year. Territorial basis unless stated.
Source: Our World in Data. Licensed under CC BY 4.0.
The moral compass
Industrialisation requires energy and energy use produces emissions. The difference is that the West already emitted its way to prosperity while China is still climbing the same ladder under a smaller per person allowance. Those who polluted first and most owe a duty to assist those still developing. That is not indulgence. It is a principled allocation of responsibility for a shared atmospheric asset.
Policy and diplomacy
Equity must include history. Any credible framework must account for cumulative emissions and per person flows. Heavy industry is the decisive frontier. Global decarbonisation will depend on clean steel cement aluminium and chemicals. China’s scale and technology capacity make it pivotal. The developing world has headroom to grow. India and peers must industrialise further to lift incomes. The United States and Europe cannot claim leadership without acknowledging their historic carbon debt. Finance technology transfer and market access are the credible levers.
Key takeaways
The stock of emissions matters more for warming than a single year of flow.
Per person energy use in the West remains far above the developing world.
China’s average citizen has used far less of the shared carbon budget than an American or a Briton.
Heavy industry is the real test of global decarbonisation and China will determine the pace.
Cumulative figures refer to territorial fossil and industry emissions unless noted. Land use change is not consistently included. Per person energy figures are primary energy and include conversion losses. Values are rounded for readability. Our World in Data charts and data are licensed under CC BY 4.0 and may be reused with attribution.
Further Reading — University Research on Cumulative Responsibility and Industrial Decarbonisation
These papers cover historical responsibility, per person energy use context, and the industrial pathways for steel, cement, aluminium and power sector decarbonisation in China.
You might also like these articles on China from telegraph.com